

Metric aggregation tools measure and store numerical data to understand what is happening in production.
If Log Aggregation is the first tool to set up for production monitoring, metrics monitoring should be the second. They are both indispensable for finding production faults and debugging performance and stability problems.
Log Aggregation primarily deals with text - logs are textual, of course. In contrast, metric aggregation deals with numbers: How long did something take? How much memory is being used?
It can be frighteningly difficult to understand what's going on in a production system. Netflix, for example, measures 2.5 billion different timeseries to monitor the health of their production deployment. Success for metric monitoring is being able to automatically notify the necessary teams when something goes wrong in production.
Prometheus
Let's keep looking at open source implementations of DevOps tools to keep things general. Prometheus, a tool originally developed at SoundCloud, is one of the most popular metrics servers.
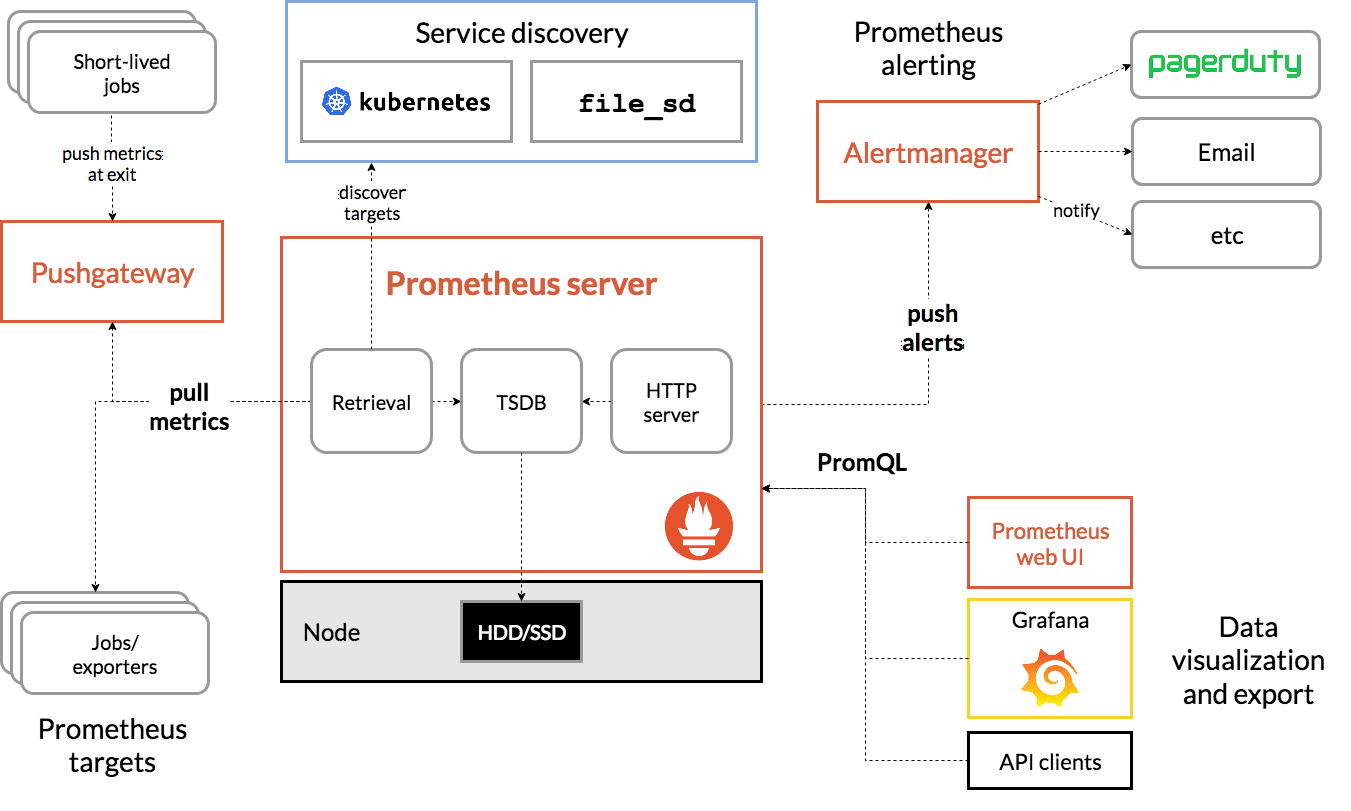
The diagram above is daunting, but quite similar to the architecture that we discussed for log aggregation frameworks. There are four key components in a Prometheus stack
- The TSDB (Time series database) actually stores the billions of individual measurements of things like page load time.
- The "retrieval" section takes data from various places, like parsing them from log messages or measuring how long individual jobs took, and puts them in the database.
- The alert manager sends notifications to relevant people (like the on-call engineer or a status page) whenever an incident is discovered.
- The web UI is primarily used to understand the metrics after someone has been alerted of a fault - it can be configured to understand individual metrics at a glance.
The sorts of metrics to collect
There is obviously a lot of subjectivity about which metrics are important based on what your product does and what your users are, but here are a few ideas of metrics and what they would be used for:
Request fulfillment times
These are very useful for understanding when systems are getting overloaded or if a newly pushed change has negatively impacted performance.
Fulfillment times are often parsed out of logs (using a regular expression, for example) or taken out of a field in a database.
For a website or REST API, a common request fulfillment time would be a "time to response" for each API and webpage, that way slow webpages can be discovered and investigated in production.
Request counts
A related metric that is very indicative of problems in production is the total number of requests. If there is a huge spike in the number of requests per second, it's very likely that at least a few production systems will have trouble scaling.
Watching request counts can also be used to identify and mitigate Denial of Service attacks, a common type of attack used against publicly accessible resources.
Server resources
The last metric that we'll talk about is server resources - finite quantities that are used in production. Here are a few examples:
- Database size and maximum database size
- Web server memory (currently used as well as maximum)
- Network throughput and capacity (900mb/s out of 1gb/s)
- TLS certificate expiry time and life left
By measuring server resources and automatically alerting as they reach critical levels, you can avoid outages like Google Voice faced in 2021.
Quartile analysis
Production faults rarely look like "no user can access anything", often they are a gradual ramp - certain APIs taking longer and longer to load until everything falls apart, for example.
Quartile analysis is an easy way to pare down production time statistics into something actionable. A website might measure how long it takes visitors to fully load their landing page to notice when there is a production issue.
With quartile analysis, they would split the request times into many different buckets:
- How long did the slowest 1% of requests take?
- How long did the slowest 5% of requests take?
- How long did the slowest 25% of requests take?
- Et cetera
For one example, stackoverflow.com was automatically notified of an outage because their landing page was taking a long time to respond to requests.
Common production metrics tools
- Promethus / Grafana - OSS, often seen in cloud native (Kubernetes/Docker) settings
- Datadog - newer, primarily SaaS, often described as expensive
- New Relic - older, perhaps more reliable and mature
- AWS CloudWatch Metrics - common choice for AWS users
- Google Cloud Monitoring - less mature version of CloudWatch Metrics
- Azure Monitor Metrics - perhaps the best interface and experience of the three top cloud providers