

PostgreSQL queries can be sped up by creating the right indices, and making sure that the indices are being used.
It's a tale as old as SQL databases - there's a critical code path being hit many times per second, but its queries are inexplicably slow.
Brief description of the system
One of the products at Webapp.io is a hosted CI/CD product that integrates with GitHub, GitLab, and BitBucket.
As mentioned in Postgres is a great pub/sub & job server, we have a table called ci_jobs which is inserted into whenever a developer commits, and it tracks the status of the CI pipeline for that commit.

It's vitally important that these status updates are pushed to GitHub, GitLab, or BitBucket on time, many organizations set CI to be required in order for code to be merged.
For that reason, we have two columns on the ci_jobs table:
CREATE TABLE ci_jobs(
  ...
  status_change_time timestamp NOT NULL DEFAULT NOW(),
  status_notify_time status_notify_time timestamp NOT NULL DEFAULT to_timestamp(0)
);
status_change_time is updated every time the status of the run changes - e.g., it's started being processed, it's crashed, or it's succeeded.
status_notify_time keeps track of what we've last told GitHub the status is - GitHub sets limits on how often you can tell it about status changes.
Finally, the listener simply polls the database for ci_job rows which have been changed, but for which GitHub hasn't been recently told about the new changes:
UPDATE ci_jobs SET status_notify_time = status_change_time
WHERE id IN (
    SELECT ci_jobs.id
    FROM ci_jobs
    WHERE ci_jobs.status_notify_time != ci_jobs.status_change_time
    AND ci_jobs.status_notify_time < NOW()-'10 seconds'::interval
    LIMIT 10
    FOR UPDATE SKIP LOCKED
)
RETURNING id
Automatic warnings for slow queries
This system has proven itself fault tolerant and quite scalable, but we knew we'd eventually hit limits on the number of updates being sent out.
For that reason, we wrapped our SQL model with a simple timer, that logged a warning if a statement took more than 100ms to execute:
startTime := time.Now()
err := dbConn.Get(dest, query, args...)
if err != nil {
	return err
}
if time.Now().Sub(startTime) > 100 * time.Millisecond {
	klog.Warningf("Query took long (%v): %v (args=%+v)", time.Now().Sub(startTime), query, args)
}
Last week our alerting system started warning us that the notification query ( UPDATE ci_jobs SET status_notify_time ) was taking over 100ms, so we had to search for ways to optimize the database query.
Diagnosing the reason that the query is slow
In the past two years of administering a large PostgresSQL instance, we've built up a repertoire of diagnostic tools. In this case, I reached for EXPLAIN ANALYZE and explain.dalibo.com
EXPLAIN ANALYZE is a prefix to a regular query that explains why a query will take a certain amount of time, instead of actually executing it.
In this case, we we analyzed the query:
EXPLAIN ANALYZE SELECT ci_jobs.id
FROM ci_jobs
WHERE ci_jobs.status_notify_time != ci_jobs.status_change_time
AND ci_jobs.status_notify_time < NOW()-'10 seconds'::interval
LIMIT 10
FOR UPDATE SKIP LOCKED;
And pasted the output into explain.dalibo.com:
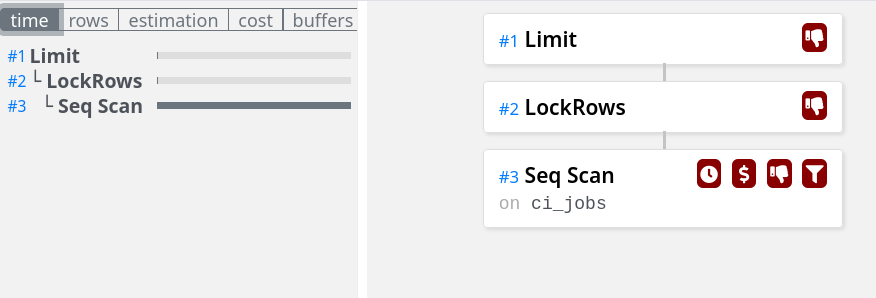
In this case, the query was slow because it was scanning every CI job that had ever occurred in order to find the ones that had recently changed.
By inspecting the query, it was simple enough to create a SQL Index that would help PostgreSQL find such rows faster:
CREATE INDEX to_be_updated_ci_jobs ON ci_jobs(id, status_notify_time ASC) WHERE (ci_jobs.status_notify_time != ci_jobs.status_change_time);This index is basically an ordered set of the rows which have different status_notify_time and status_change_time fields, ordered by status_notify_time ascending.
However, the index wasn't being used!
EXPLAIN ANALYZE SELECT ci_jobs.id
FROM ci_jobs
WHERE ci_jobs.status_notify_time != ci_jobs.status_change_time
AND ci_jobs.status_notify_time < NOW()-'10 seconds'::interval
LIMIT 10
FOR UPDATE SKIP LOCKED;

Planning Time: 0.218 ms
Execution Time: 2064.317 ms
PostgreSQL wasn't using the index we'd created. A solid hypothesis why is that we are choosing 10 arbitrary rows, and not the 10 oldest.
Indeed, if we told it that we wanted the 10 oldest rows:
EXPLAIN ANALYZE SELECT ci_jobs.id
FROM ci_jobs
WHERE ci_jobs.status_notify_time != ci_jobs.status_change_time
AND ci_jobs.status_notify_time < NOW()-'10 seconds'::interval
ORDER BY ci_jobs.status_notify_time
LIMIT 10
FOR UPDATE SKIP LOCKED;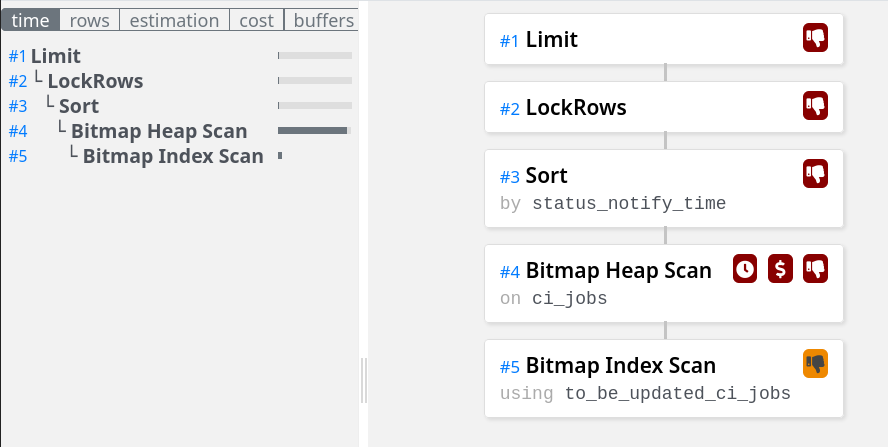
The query used our index (an Index scan instead of the original Sequential scan), and our execution time plummeted to 24ms from 2000ms.
In time, the query estimator might better understand why this index is so small (very few jobs are being changed, most are for commits long passed) and we'll be able to drop the ORDER BY, but for now it's required for a 100x speed up.
Before index and ORDER BY: 2064ms
After index and ORDER BY: 24ms
Discussion: Reddit